Moving Average Convergence Divergence
Relative Strength Index
Money Flow Index
Commodity Channel Index
Doji

Introduction
Moving Average Convergence Divergence (MACD) is a trend following indicator, and is designed to identify trend changes.
Formula
MACD = EMA[12] of price - EMA[26] of price
where: EMA[12] = 12 days exponential moving average, EMA[24] = 24 days exponential moving average.
Interpretation
When MACD is positive, the stock is moving in upward trend. When MACD is negative, the stock is moving in downward trend.
Case Study
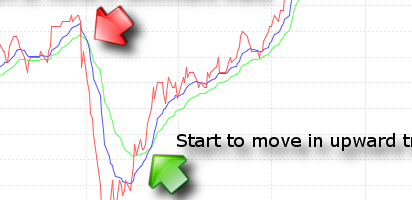
As shown in the graph above.
In Mar-2009, EMA[12] (in blue line) starts to cross below EMA[26] (in green line). PUBLIC BANK BHD starts to move in downward trend.
In April, EMA[12] starts to cross above EMA[26]. PUBLIC BANK BHD starts to move in upward trend.
Different groups of investor will have different interpretation on both situation. During downward trend (negative MACD), some investors view it as a signal to accumulate share in cheap price. However, some investors may view it as a signal to sell off share on hand, to avoid further paper loss.
Final Note
There is no exact right period for MACD. The longer the time period, the less sensitive the moving average to daily price change noises. User shall experiment with various time period, according to current market condition.
Reference
 中文
中文 English