- Home
- ·
- Download
- ·
- Features
- ·
- Indicators
- ·
- Testimonial
- ·
 English
 中文
Moving Average Convergence Divergence
Relative Strength Index
Money Flow Index
Commodity Channel Index
Doji
Introduction
Relative Strength Index (RSI) is a financial technical analysis momentum oscillator measuring the velocity and magnitude of directional price movement by comparing upward and downward close-to-close movements.
Formula
RSI = 100 - [100/(1 + RS)]
where: RS = (Avg. of n-day up closes)/(Avg. of n-day down closes), n= days (most analysts use 9 - 15 day RSI)
Interpretation
The RSI ranges from 0 to 100. If the RSI approaches 30 a stock is considered oversold. A stock is considered overbought around the 70 level and you should consider selling.
Case Study
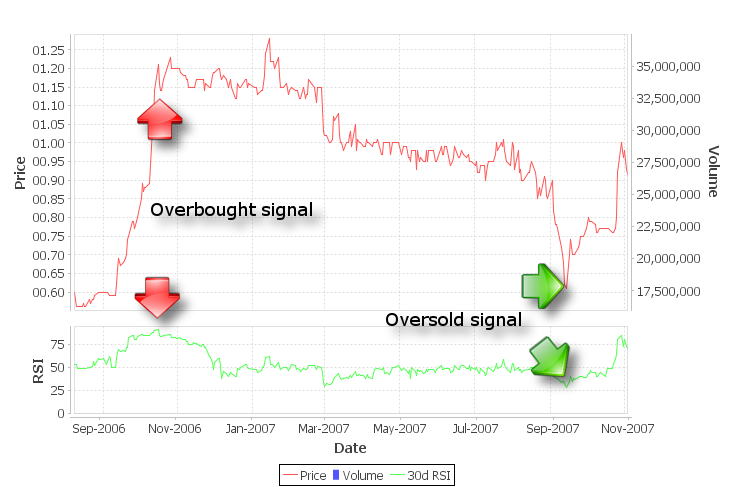
As shown in the graph above.
In Oct-2006, RSI (in green line) starts to cross up over 75. VITROX COPORATIO starts to have overbought signal.
In Sep-2007, RSI starts to cross down toward 25. VITROX COPORATIO starts to have oversold signal.
This is a quote by Warren Buffet: "Be fearful when everyone is greedy. Be greedy when everyone is fearful"
Prepare to sell off your shares when everyone is rushing to buy. Prepare to buy more shares when everyone is rushing to sell.
Final Note
There is no exact right period for RSI. The longer the time period, the less sensitive the moving average to daily price change noises. User shall experiment with various time period, according to current market condition.
User shall also adjust overbought threshold level from 70 to 80 during bull market. Oversold from 30 to 20 during bear market.
Reference