- Home
- ·
- Download
- ·
- Features
- ·
- Indicators
- ·
- Testimonial
- ·
 English
 中文
中文Moving Average Convergence Divergence
Relative Strength Index
Money Flow Index
Commodity Channel Index
Doji
Introduction
Money flow index (MFI) is an oscillator calculated over an N-day period, ranging from 0 to 100, showing money flow on up days as a percentage of the total of up and down days. It is a momentum indicator similar in function to the Relative Strength Index (RSI). The primary difference being that while the RSI only incorporates prices, the MFI accounts for volume.
Formula
MFI = 100 - 100 / (1 + Money Ratio)
Money Ratio = Positive Money Flow / Negative Money Flow
Money Flow = Typical Price x Volume
Typical Price (TP) = (H+L+C)/3 where H = high, L = low, and C = close.
Interpretation
The MFI ranges from 0 to 100. If the MFI approaches 70, the price is moving, with a lot of interest in that trade, and it will most likely continue in the future. If the MFI approaches 30, the price is moving, with little interest in that trade, and it will most likely fail.
By measuring both volume and price action, the money flow index is able to tell you if there is a lot of interest or just limited interest. If there is a lot of interest, you can have more confidence in your trade. If there is limited interest, you may want to reconsider your trade.
Case Study
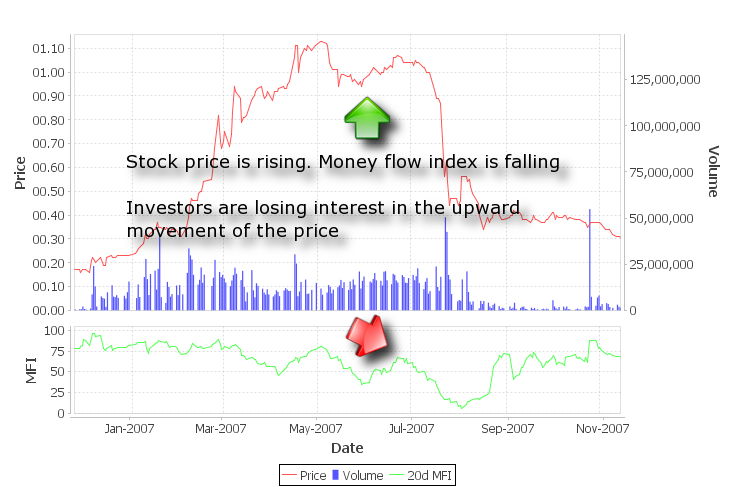
As shown in the graph above.
ASIAEP BHD is in its all times high. The price is rising while MFI is falling. Investors are losing interest in the upward movement of the price, and the price may not have enough support to continue to push it higher.
Some investors may view falling MFI as a signal to sell off share on hand, before there is a large sell volume, which will cause the price going down further.
Final Note
There is no exact right period for MFI. The longer the time period, the less sensitive the MFI to short term changes. User shall experiment with various time period, according to current market condition.
Reference