- Home
- ·
- Download
- ·
- Features
- ·
- Indicators
- ·
- Testimonial
- ·
 English
 中文
中文Moving Average Convergence Divergence
Relative Strength Index
Money Flow Index
Commodity Channel Index
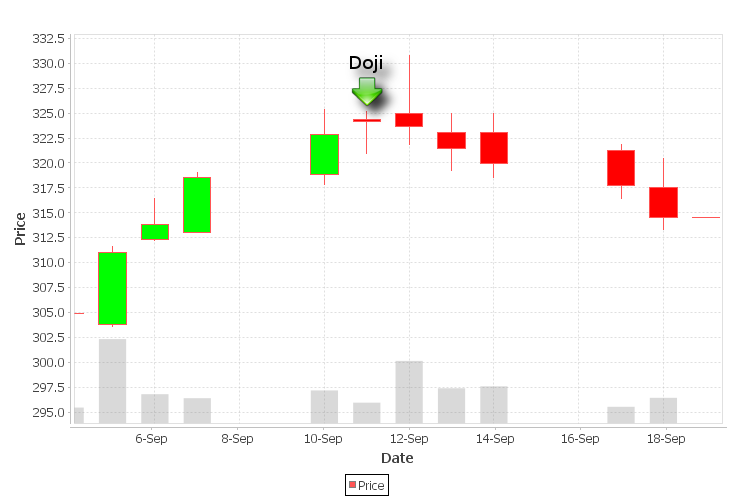
Doji
Introduction
A doji is a key trend reversal indicator.
Formula
Open price = Close price
Interpretation
The relevance of a doji depends on the preceding trend or preceding candlesticks. After an advance, or long green candlestick, a doji signals that the buying pressure is starting to weaken. After a decline, or long red candlestick, a doji signals that selling pressure is starting to diminish. Doji indicate that the forces of supply and demand are becoming more evenly matched and a change in trend may be near. Doji alone are not enough to mark a reversal and further confirmation may be warranted.
Case Study
As shown in the graph above.
The circled candle shows the reversal of trend. Doji convey a sense of indecision or tug-of-war between buyers and sellers. Prices move above and below the opening level during the session, but close at or near the opening level. The result is a standoff.
Reference
Credit
Doji pre-built indicator and tutorial are provided by Parth Khare.